DrillPre-K to K
Sorting and classifying shapes
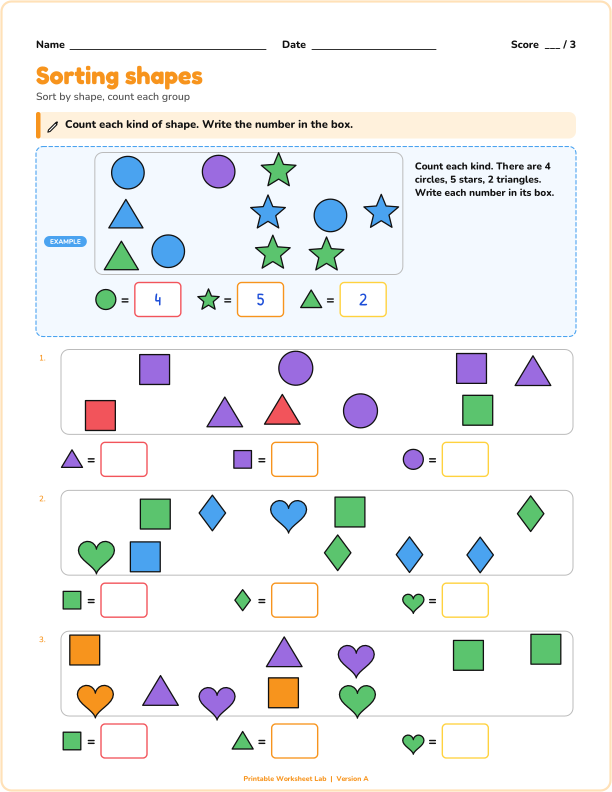
Sort a group of shapes by one attribute: count each kind, or circle every shape that matches.
Read a bar graph and answer questions, or shade the bars to match a table.
Choose whether students read a finished graph (how many chose one thing, how many more chose one than another, how many in all) or build a graph by shading each bar to match a table. Bars can stand up or lie sideways, and each line on the graph can count for 1, 2, 5 or 10.
With a scale of 2 or 10 you can allow half steps, so some bars end halfway between two lines. The answer key shows the finished graph or the correct answers, and every version has different numbers.
US Letter or A4, portrait: choose your paper size above. Print at 100 percent (actual size). Use "Black and white" for the copier, or "Color" for display pages and mini books.
Ready-made settings for common topics.
Sort a group of shapes by one attribute: count each kind, or circle every shape that matches.
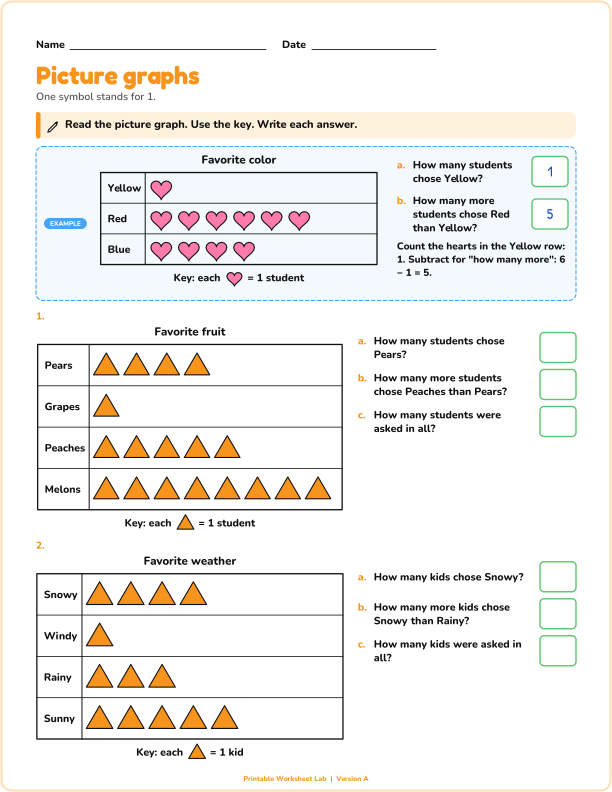
Read a picture graph where one symbol stands for 1, 2, 5 or 10 and answer questions.
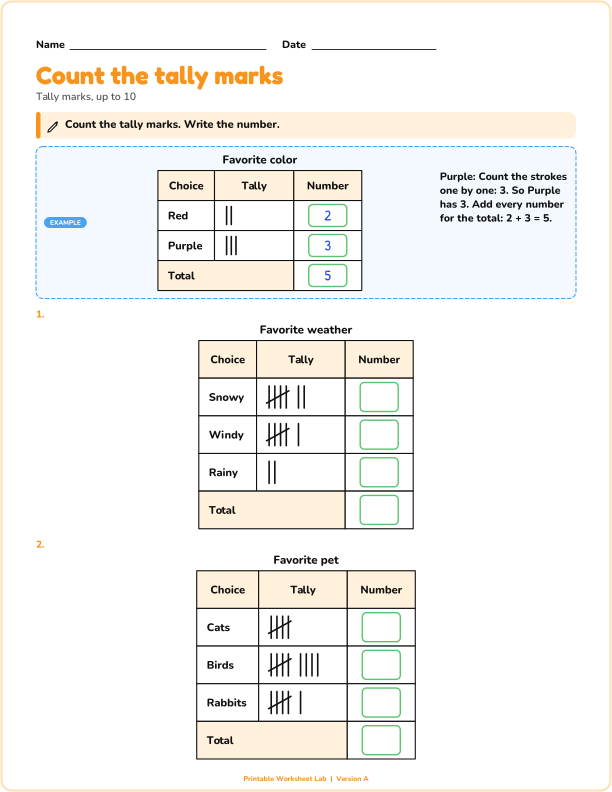
Count tally marks, draw tally marks for a number, or tally a list into a frequency table.