DrillPre-K to K
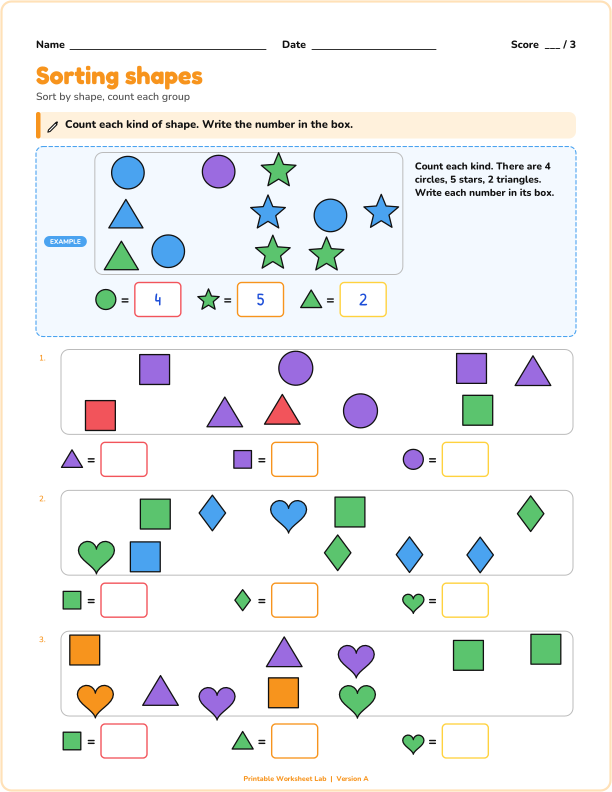
Sorting and classifying shapes
Sort a group of shapes by one attribute: count each kind, or circle every shape that matches.
Graphs, averages and chance. Printable worksheets, puzzles, games and mini books with answer keys.
Sort a group of shapes by one attribute: count each kind, or circle every shape that matches.
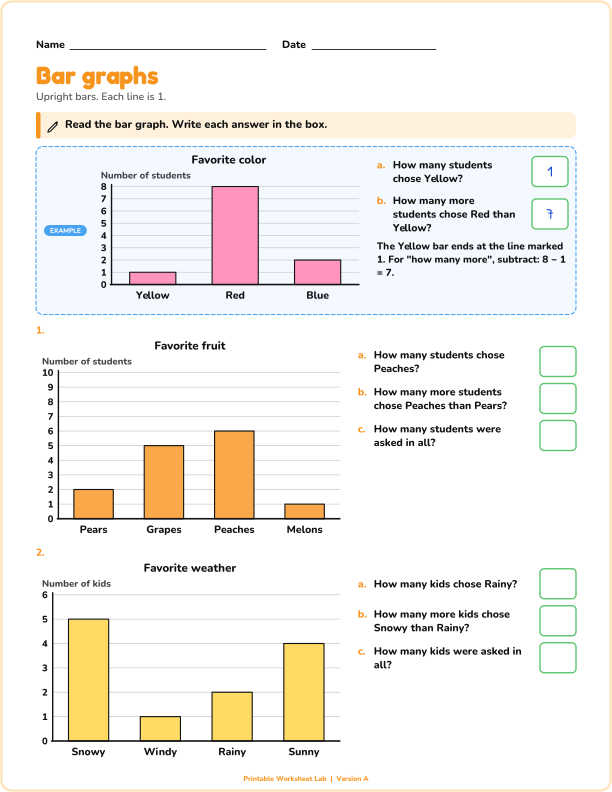
Read a bar graph and answer questions, or shade the bars to match a table.
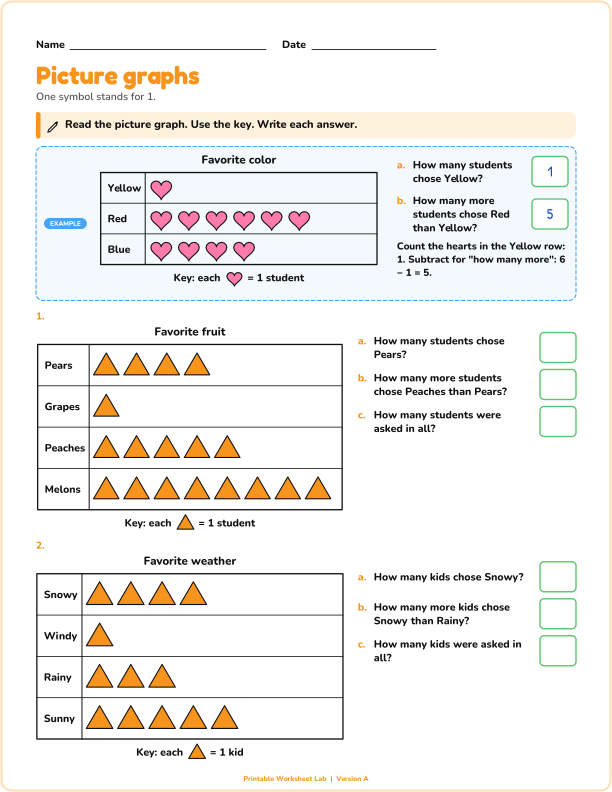
Read a picture graph where one symbol stands for 1, 2, 5 or 10 and answer questions.
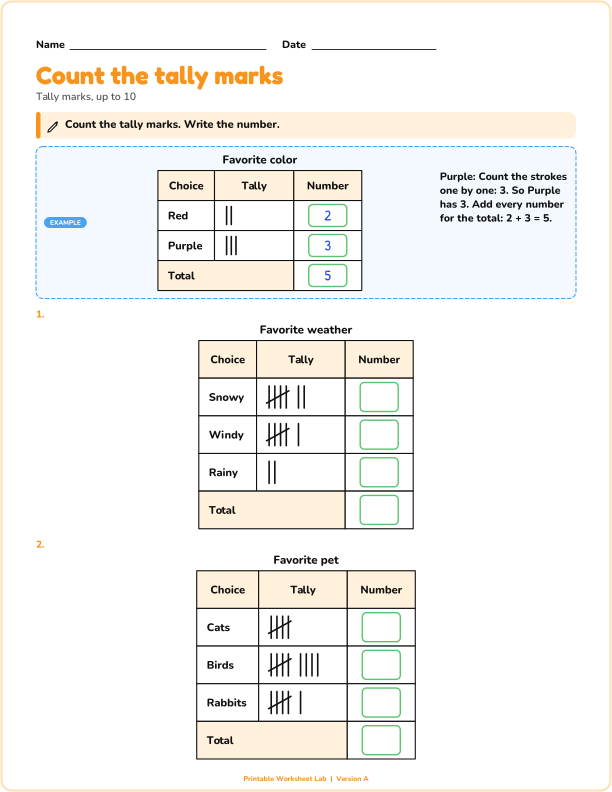
Count tally marks, draw tally marks for a number, or tally a list into a frequency table.
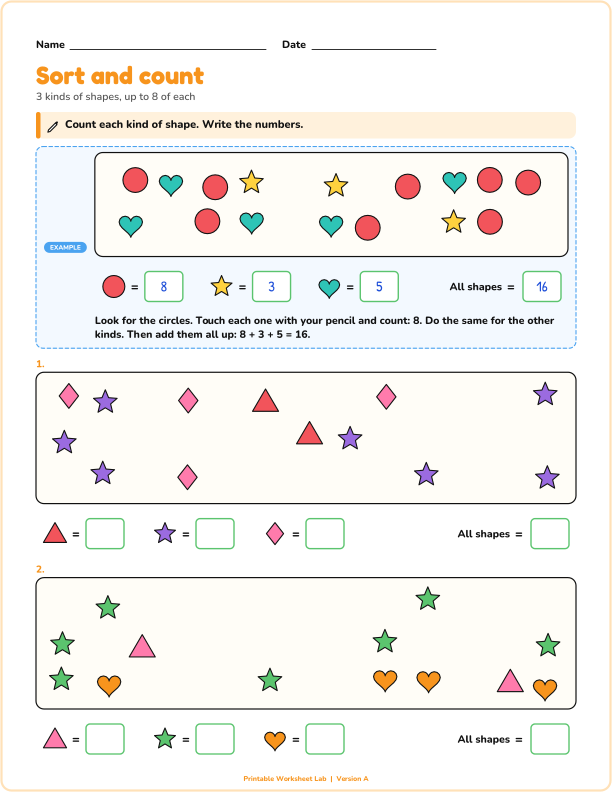
Count each kind of shape in a mixed group and write how many of each, and how many in all.
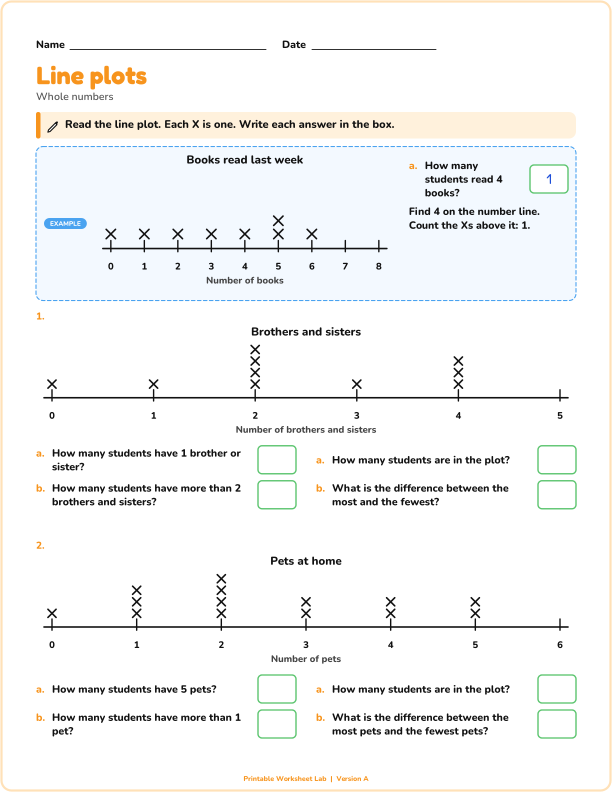
Read a line plot, or mark Xs on a number line, with whole numbers, halves or quarters of an inch.
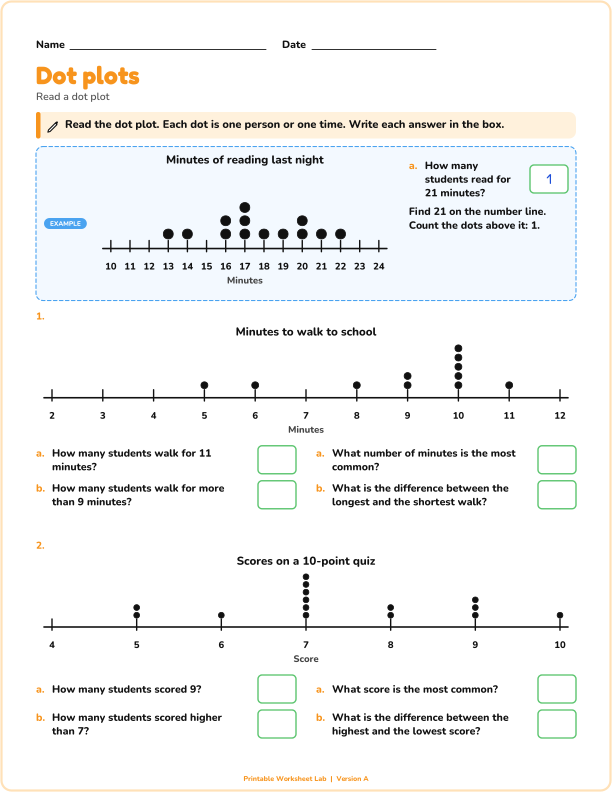
Read a dot plot and find a count, a number of values above a point, the most common value and the range.
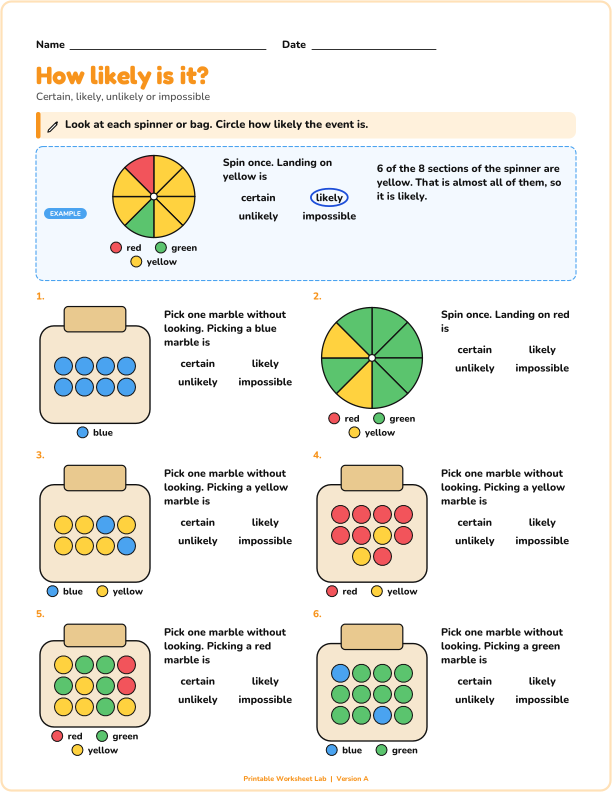
Look at a spinner or a bag of marbles and circle how likely an event is.
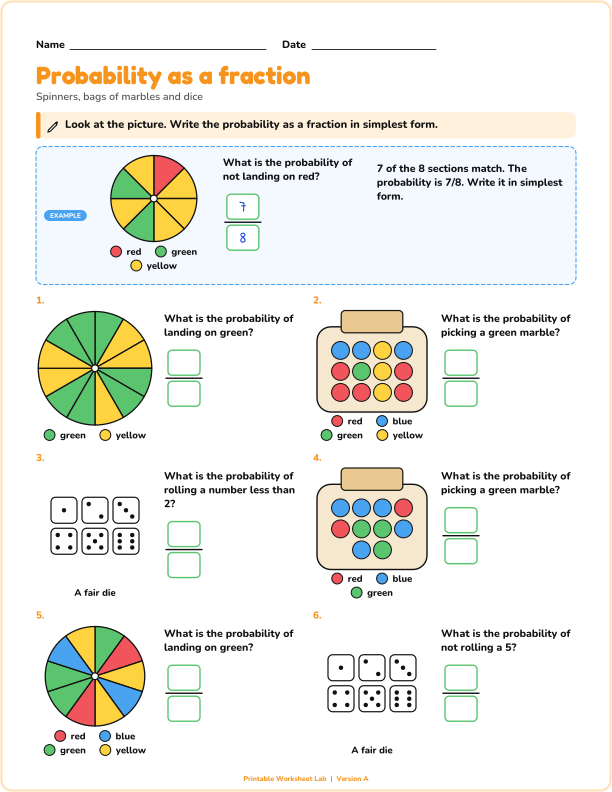
Find the probability of an event for a spinner, a bag of marbles or a die and write it as a fraction.
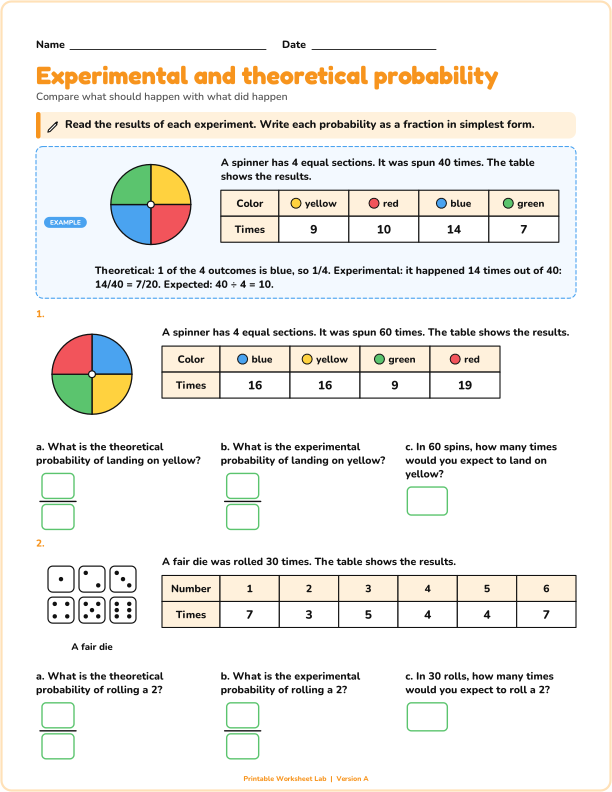
Use a table of results from a spinner, die or coin to compare what should happen with what did happen.
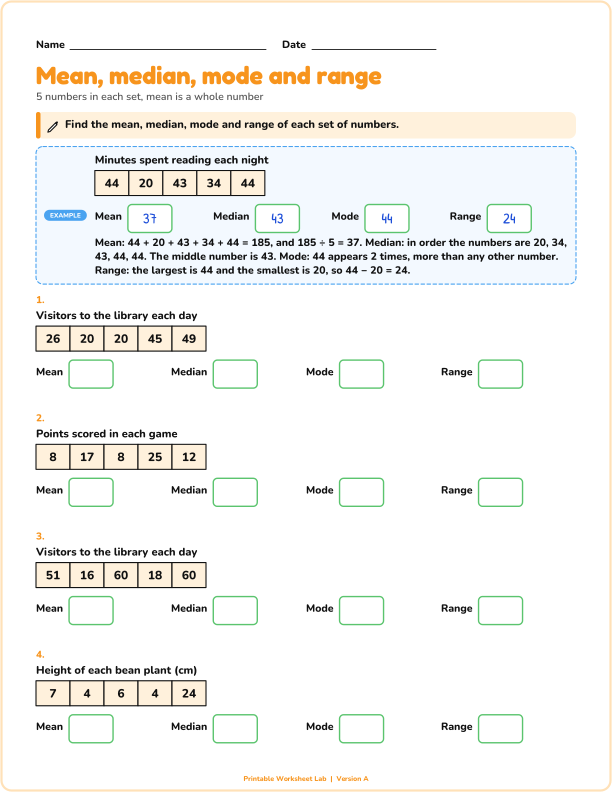
Find the mean, median, mode and range of sets of numbers, one statistic at a time or all four together.
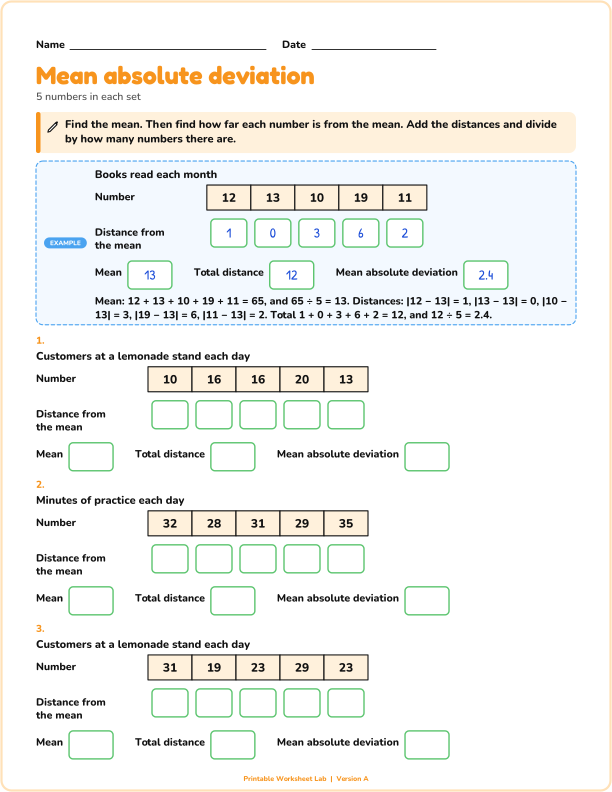
Find the mean, the distance of each number from the mean, and the mean absolute deviation.
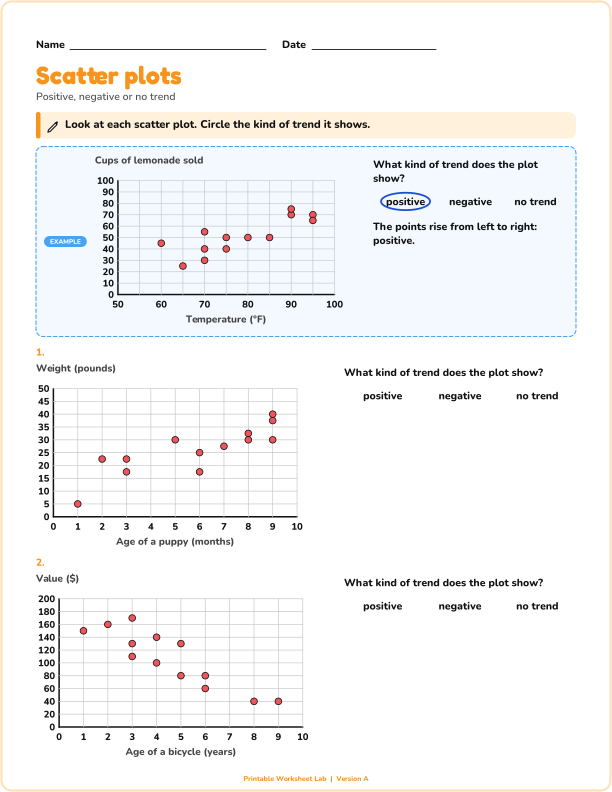
Read the trend of a scatter plot (positive, negative or none) and use a line through the points to estimate a value.
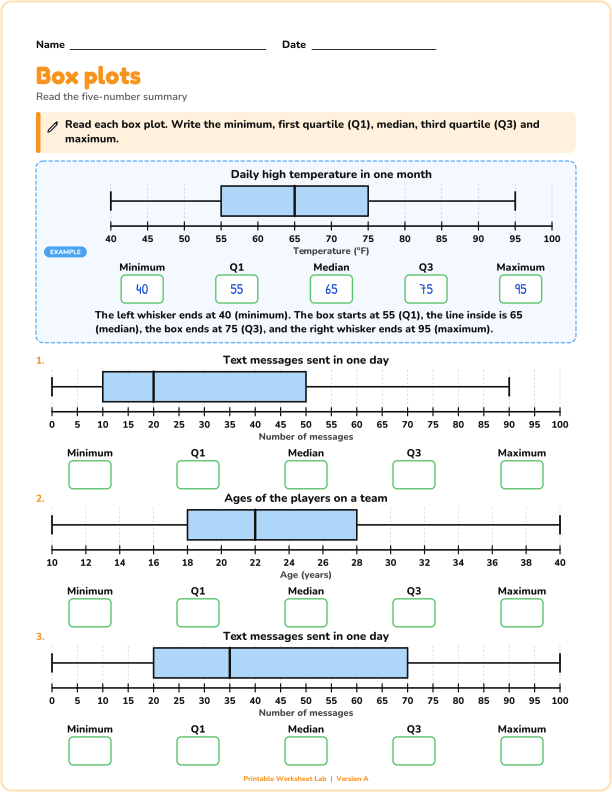
Read a box plot and write the five-number summary, the range and the interquartile range.
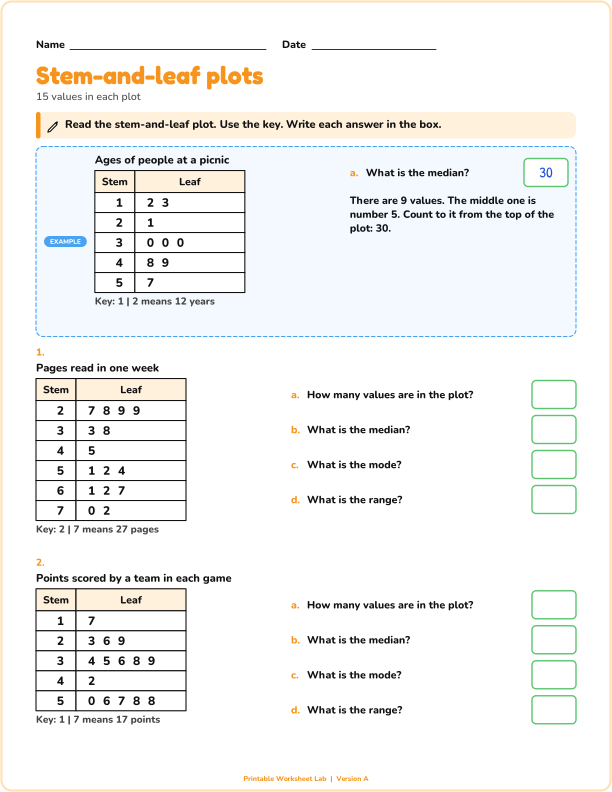
Read a stem-and-leaf plot, or build one from a list of numbers.
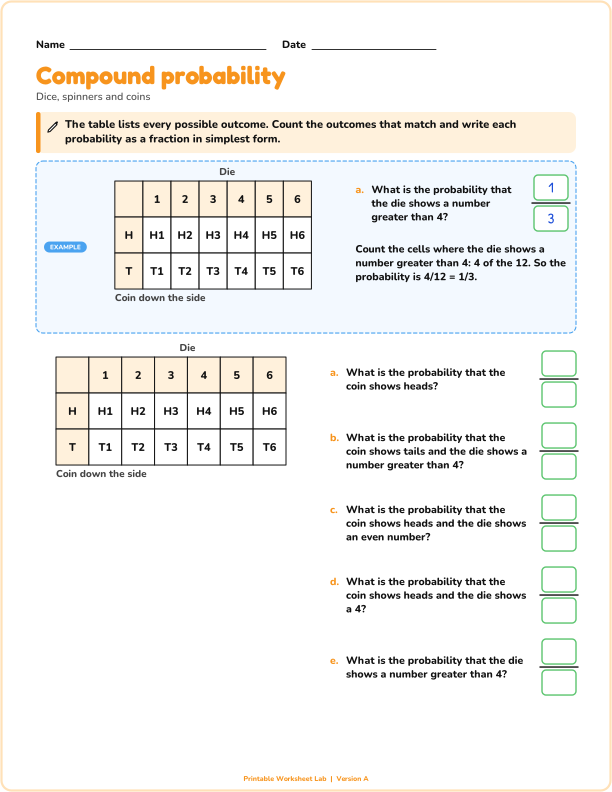
Use a table of every outcome for two dice, two spinners or a coin and a die to find probabilities.
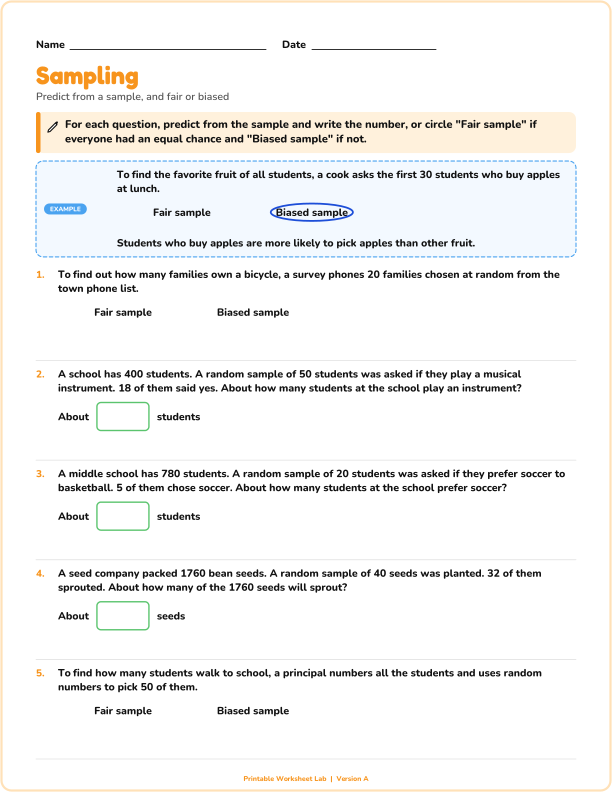
Use a random sample to predict a whole group, and decide whether a sample is fair or biased.