DrillPre-K to K
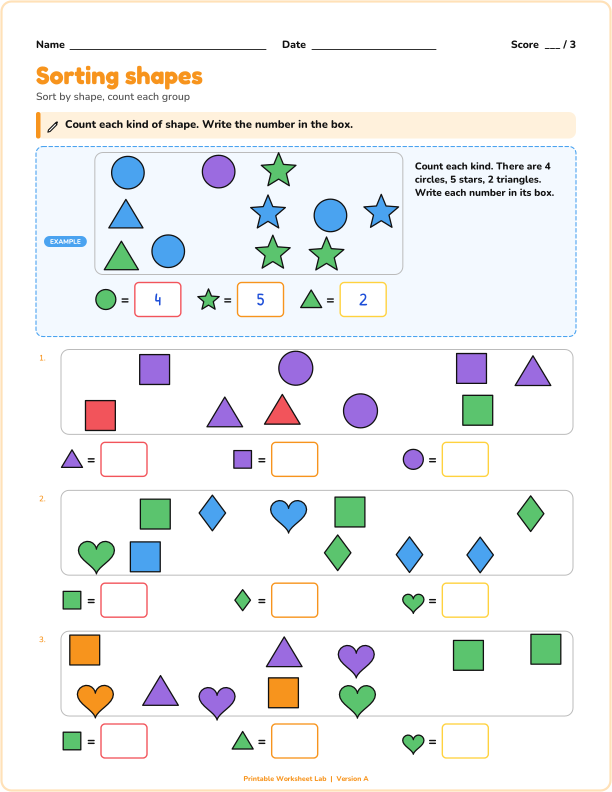
Sorting and classifying shapes
Sort a group of shapes by one attribute: count each kind, or circle every shape that matches.
Read the trend of a scatter plot (positive, negative or none) and use a line through the points to estimate a value.
Each scatter plot shows thirteen points for a real-life pair of measurements, such as hours studied and test score. Students circle whether the trend is positive, negative or there is no trend, and where a line is drawn through the points they use it to estimate a value.
The plots are built so the trend is always clear (no borderline cases), and the line passes exactly through a crossing of grid lines at the question, so the estimate is read off the line without guessing. Choose trend questions, estimate questions or both.
US Letter or A4, portrait: choose your paper size above. Print at 100 percent (actual size). Use "Black and white" for the copier, or "Color" for display pages and mini books.
Ready-made settings for common topics.
Sort a group of shapes by one attribute: count each kind, or circle every shape that matches.
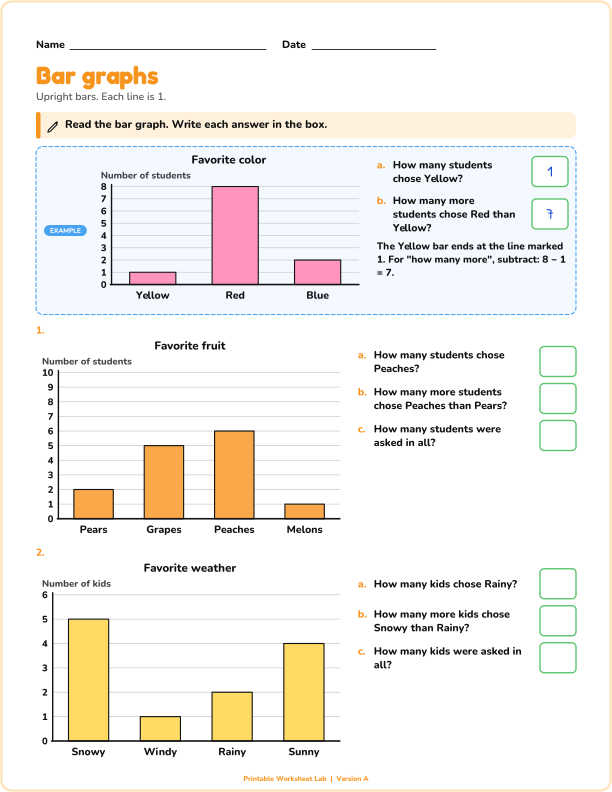
Read a bar graph and answer questions, or shade the bars to match a table.
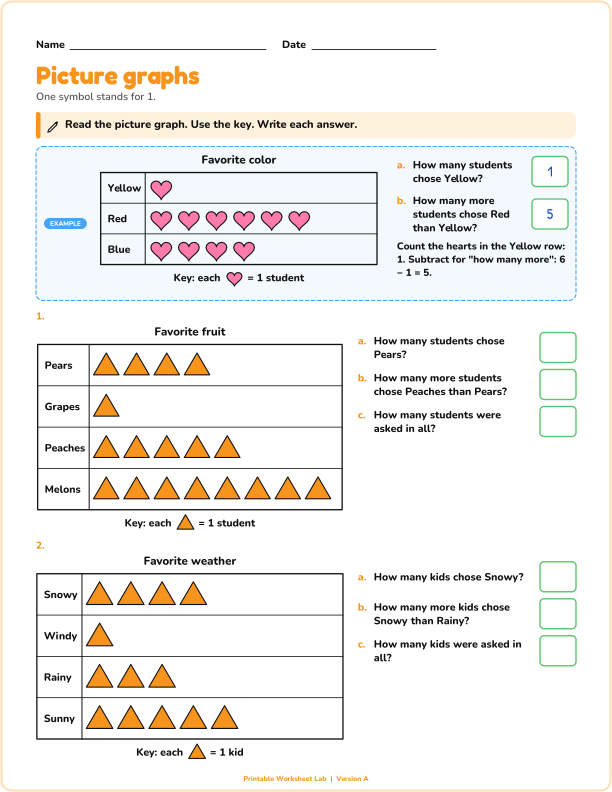
Read a picture graph where one symbol stands for 1, 2, 5 or 10 and answer questions.