DrillPre-K to K
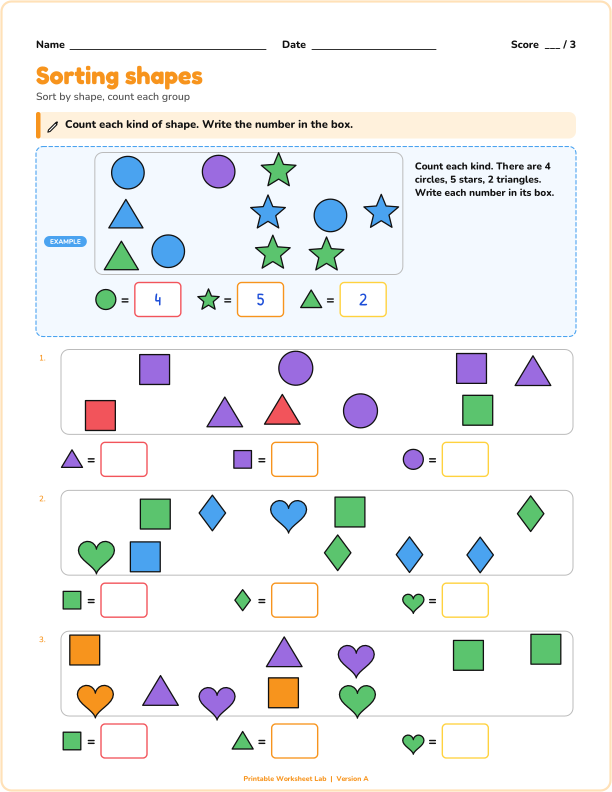
Sorting and classifying shapes
Sort a group of shapes by one attribute: count each kind, or circle every shape that matches.
Read a line plot, or mark Xs on a number line, with whole numbers, halves or quarters of an inch.
A line plot shows every piece of data as an X above a number line. Students either read a finished plot and answer questions (how many at one value, how many more than a value, how many in all, the longest or tallest) or draw the Xs themselves from a list of numbers.
Choose whole numbers (pets, books, goals) or measurements to the nearest half inch or quarter inch, which are the lengths the third and fourth grade standards ask for. The answer key shows the finished plot or the correct answers.
US Letter or A4, portrait: choose your paper size above. Print at 100 percent (actual size). Use "Black and white" for the copier, or "Color" for display pages and mini books.
Ready-made settings for common topics.
Sort a group of shapes by one attribute: count each kind, or circle every shape that matches.
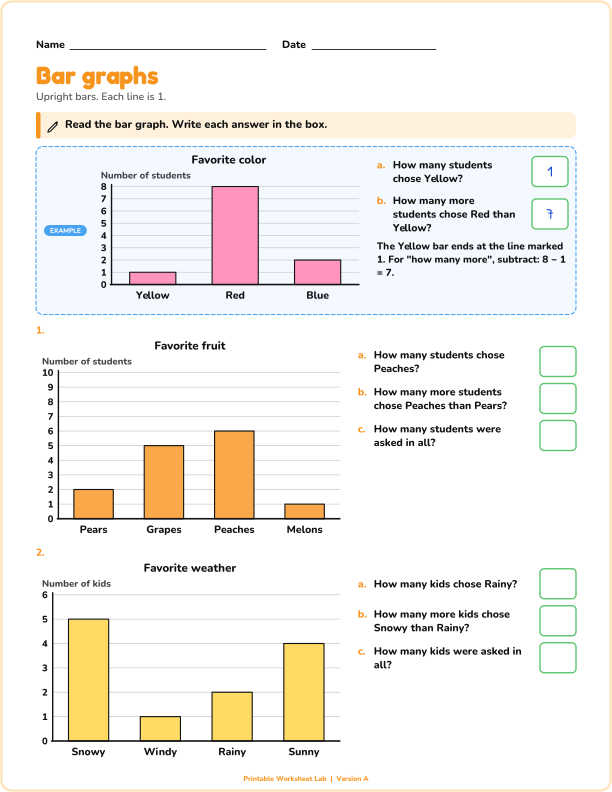
Read a bar graph and answer questions, or shade the bars to match a table.
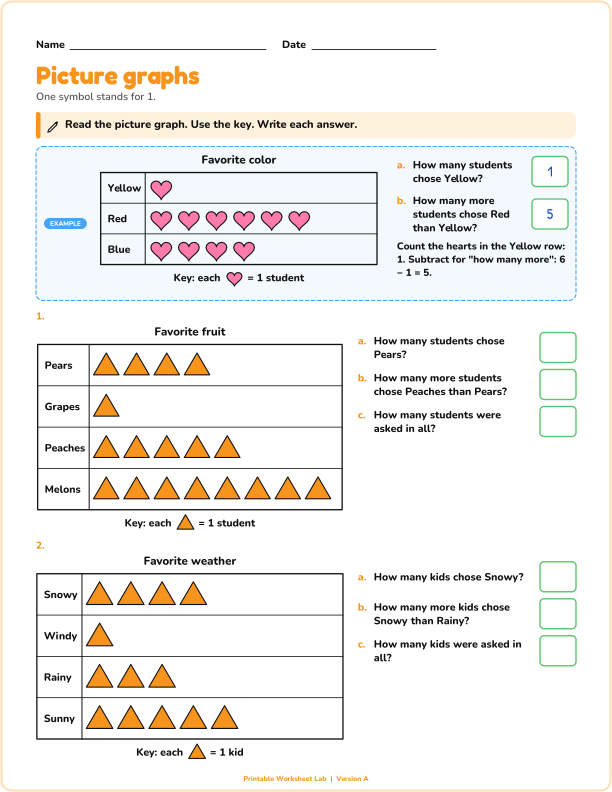
Read a picture graph where one symbol stands for 1, 2, 5 or 10 and answer questions.