DrillPre-K to K
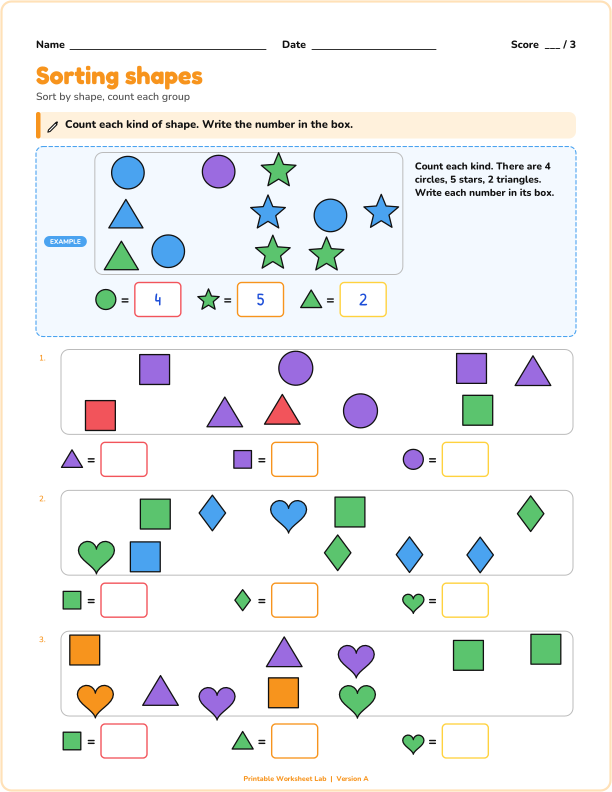
Sorting and classifying shapes
Sort a group of shapes by one attribute: count each kind, or circle every shape that matches.
Students use a table of die rolls to write the theoretical and experimental probability and how many times to expect an outcome.
Students use a table of die rolls to write the theoretical and experimental probability and how many times to expect an outcome.
You can change any of these settings above. Press "New problems" for a fresh set with the same settings, or pick Version A to Z to print different sheets for neighboring desks. The answer key always matches.
Each experiment shows a table of results. Students write the theoretical probability (what should happen if every outcome is equally likely), the experimental probability (what actually happened out of all the tries) and how many times they would expect an outcome.
The results are close to the expected numbers but never exactly equal for the outcome that is asked about, so the two probabilities always differ a little. Fractions are written in simplest form.
US Letter or A4, portrait: choose your paper size above. Print at 100 percent (actual size). Use "Black and white" for the copier, or "Color" for display pages and mini books.
Sort a group of shapes by one attribute: count each kind, or circle every shape that matches.
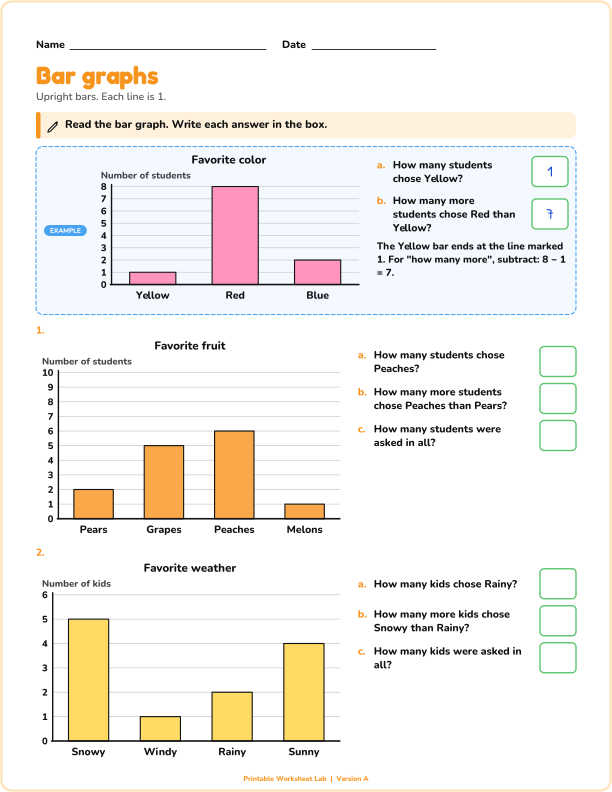
Read a bar graph and answer questions, or shade the bars to match a table.
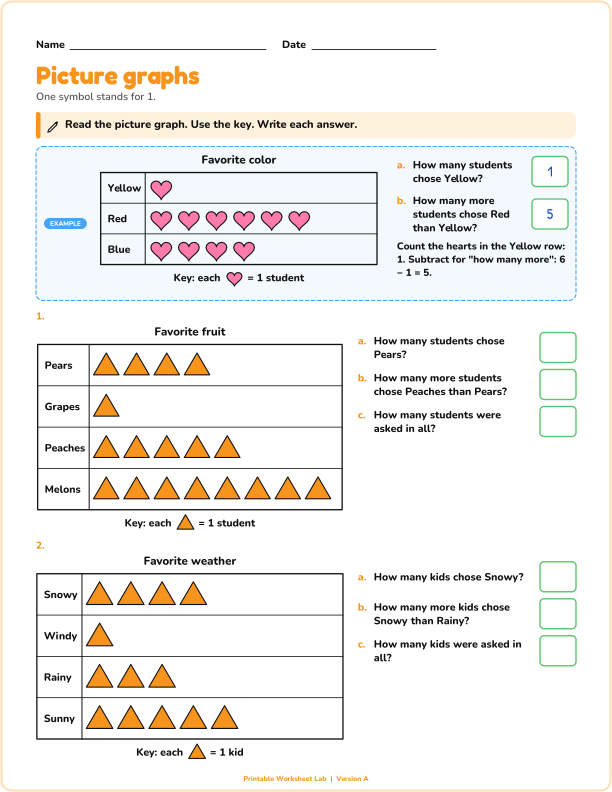
Read a picture graph where one symbol stands for 1, 2, 5 or 10 and answer questions.