DrillPre-K to K
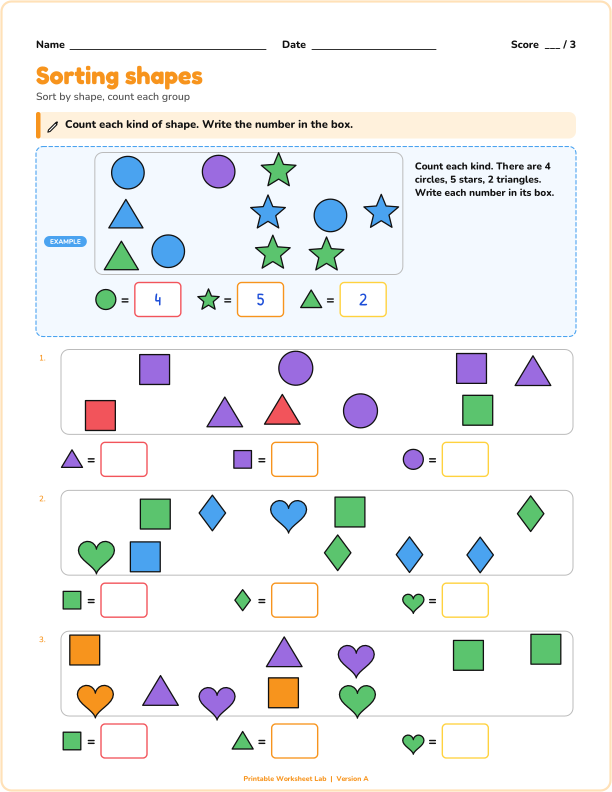
Sorting and classifying shapes
Sort a group of shapes by one attribute: count each kind, or circle every shape that matches.
Students sort a mixed-up list of 19 two-digit numbers into stems and leaves to build a longer plot.
Students sort a mixed-up list of 19 two-digit numbers into stems and leaves to build a longer plot.
You can change any of these settings above. Press "New problems" for a fresh set with the same settings, or pick Version A to Z to print different sheets for neighboring desks. The answer key always matches.
In a stem-and-leaf plot each two-digit number is split into a stem (the tens digit) and a leaf (the ones digit). Students read a finished plot and find how many values it shows, the median, the mode and the range, or build the plot from a mixed-up list of numbers.
Every plot has an odd number of values, so the median is one of the values, and a single mode, so each question has one answer. A key under each plot shows how to read it.
US Letter or A4, portrait: choose your paper size above. Print at 100 percent (actual size). Use "Black and white" for the copier, or "Color" for display pages and mini books.
Sort a group of shapes by one attribute: count each kind, or circle every shape that matches.
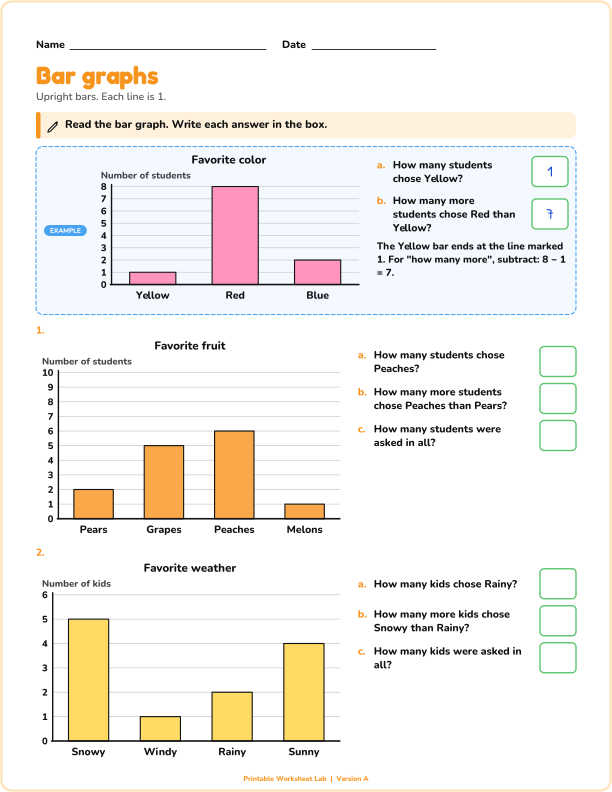
Read a bar graph and answer questions, or shade the bars to match a table.
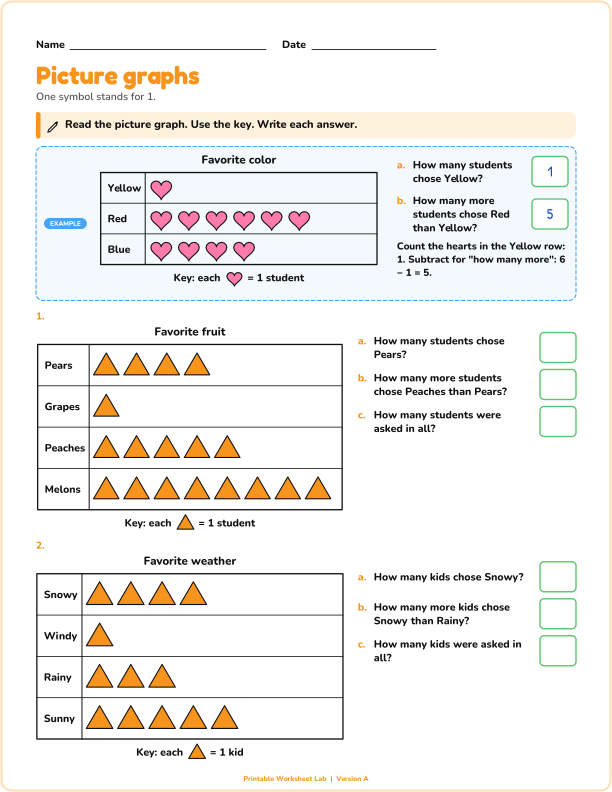
Read a picture graph where one symbol stands for 1, 2, 5 or 10 and answer questions.