DrillPre-K to K
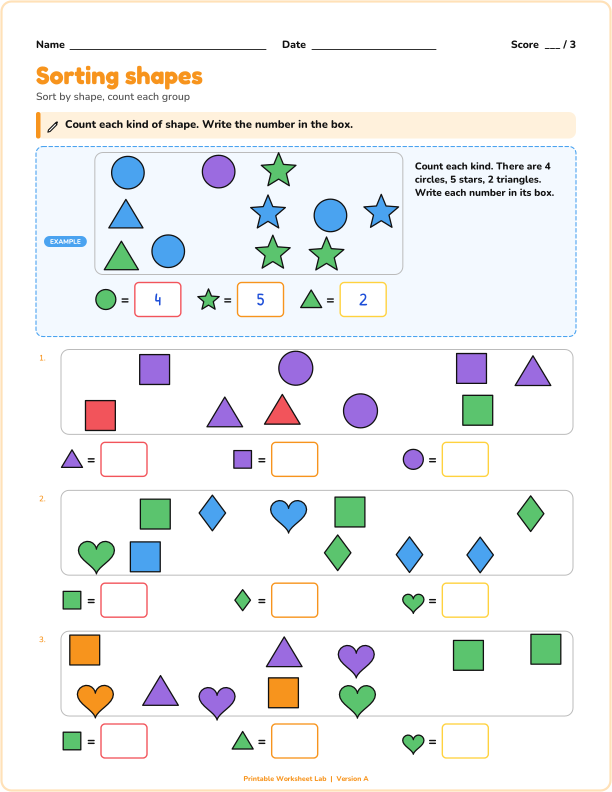
Sorting and classifying shapes
Sort a group of shapes by one attribute: count each kind, or circle every shape that matches.
Each plot shows 19 values, and students find how many values it shows, the median, the mode and the range.
Each plot shows 19 values, and students find how many values it shows, the median, the mode and the range.
You can change any of these settings above. Press "New problems" for a fresh set with the same settings, or pick Version A to Z to print different sheets for neighboring desks. The answer key always matches.
In a stem-and-leaf plot each two-digit number is split into a stem (the tens digit) and a leaf (the ones digit). Students read a finished plot and find how many values it shows, the median, the mode and the range, or build the plot from a mixed-up list of numbers.
Every plot has an odd number of values, so the median is one of the values, and a single mode, so each question has one answer. A key under each plot shows how to read it.
US Letter or A4, portrait: choose your paper size above. Print at 100 percent (actual size). Use "Black and white" for the copier, or "Color" for display pages and mini books.
Sort a group of shapes by one attribute: count each kind, or circle every shape that matches.
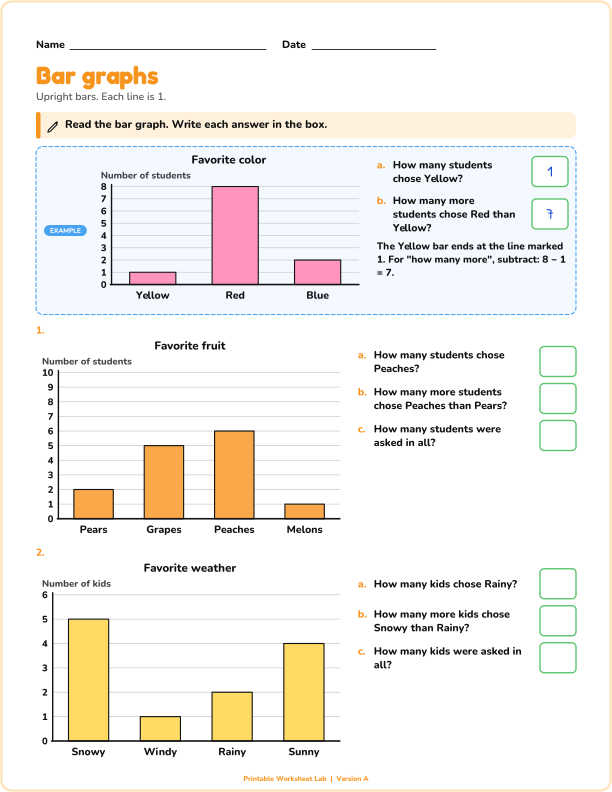
Read a bar graph and answer questions, or shade the bars to match a table.
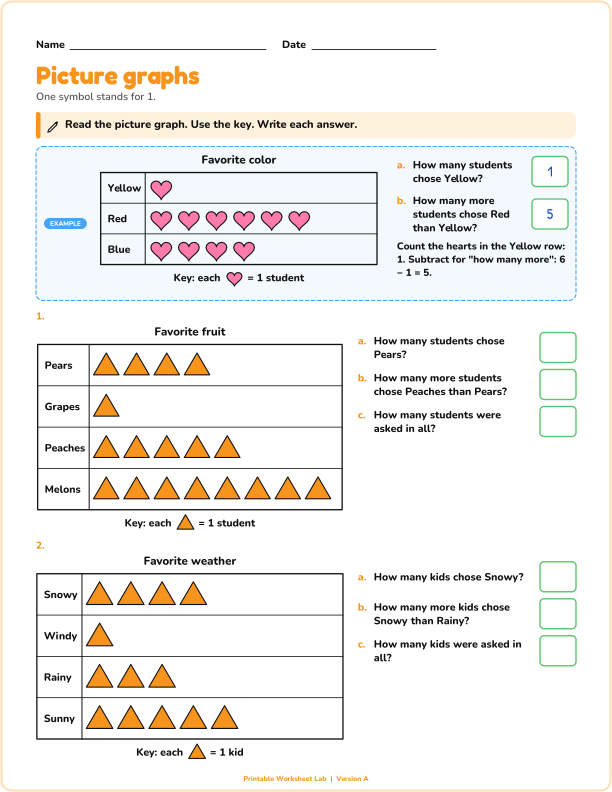
Read a picture graph where one symbol stands for 1, 2, 5 or 10 and answer questions.